Despite the warmth in the Eastern USA so far these past few weeks, the late fall and winter period is fast approaching. That means that things will eventually start to cool off, the leaves will begin to change, and the holiday row of Halloween, Thanksgiving, Christmas, and New Years will commence. One thing that is being discussed in the weather and climate community is the return of El-Nino.
What is El-Nino
El-Nino is Spanish for Christ Child and it refers to above average water temperatures in the Eastern Pacific (off the coast of South America). This is important because El-Nino typically is responsible for a strong subtropical jet across the Southern USA. The result of that is typically above average precipitation across the southern USA from Southern California through the Gulf Coast states and sometimes up the East Coast. El Nino typically occurs every 2 to 7 years.
El Nino Types and Orientations
Not all El-Nino’s are created equal. El-Nino’s tend to be classified by their strength and directional orientation.
Super El-Nino’s: +2.0C or greater departure in the El-Nino region of the Pacific
Strong El Nino: +1.5C to +1.90C departure in the El-Nino region of the Pacific
Moderate El-Nino: +1.0C to +1.49C departure in the El-Nino region of the Pacific
Weak El-Nino: +0.5 to +0.99C departure in the El-Nino region of the Pacific
The stronger the El-Nino the stronger its effects will be. That would typically include warmer than normal conditions across much of the USA (minus the Gulf Coast areas and Desert SW due to the influence of the Sub Tropical Jet) as mild Pacific air floods into the country. If the El-Nino is weak or moderate then it is more likely that impacts like a negative North Atlantic Oscillation could form and dominate the pattern more so than the El-Nino. Typically the weather and winter impacts in the USA are a lot harder to predict with weak to moderate El-Nino’s versus the strong and super events.
There are also different orientations an El-Nino can take. The Winters of 2002-03 and 2009-10 caused quite a bit of confusion because despite being relatively significant El-Nino events (right on the Moderate to the Strong border) in their impacts. The USA especially the Eastern USA was much colder than usual considering the strength of the El-Nino. This was because the El-Nino was west-based in which the warmth was more focused on the Central parts of the East Pacific and not the areas closer to South America. This is known as a Modoki El-Nino.
El-Nino’s Impacts in the USA:
- El-Nino tends to produce below average precipitation and above average temperatures across the northern tier of the USA and into much of Canada. Seattle natives often note that El-Nino winters are typically not as cloudy and gloomy as typically noted.
- El-Nino tends to produce above-average precipitation and average to below average temperatures in the Sun Belt region of the USA or from the Desert Southwest across Texas and then along the Gulf-Coast.
- Drier than normal conditions tend to occur in the Ohio-Valley region (IL, IN, KY, OH, MO, N TN)
- The weaker the El-Nino typically the more variable the weather can be. With both very warm winters and cold and snowy winters possible depending on other variables like the North Atlantic Oscillation (NAO) and such.
- If the El-Nino is west based or Modoki it tends to feature drought-like conditions in the Pacific Northwest and a cold and snowy conditions in the Lower Midwest, Northeast, and Southeastern USA.
- East based El-Nino’s can lead to warmer conditions in the Eastern USA.
- Remember that not all El Nino’s are created equal and not every Modoki El-Nino are equal.
What Does It Mean for Winter:
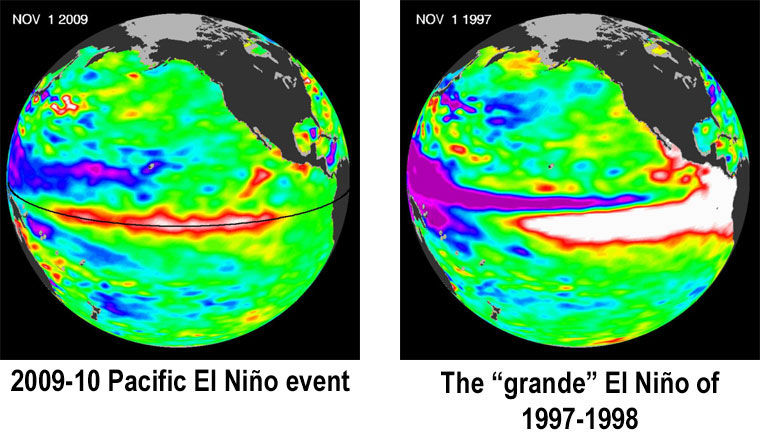
This models so far show a weak to moderate El Nino with the average sea surface temperature reading of around +1.0C. This would be around the strength of the 2006-07 El-Nino and just slightly weaker than 2002-03 for comparison. It will be nothing like the super EL Nino’s of 1997-98 or 2015-16. There is also a tendency for this to be a Modoki or West-Based El-Nino.
For Kentucky and Tennessee, this means a higher chance for average to below average temperatures and below average temperatures. Remember that snow typically contains around 1/10th of the water content as rain does in the KY/TN area.
Nationwide this supports above average temperatures in the Pacific Northwest and perhaps the Northern Plains and above average precipitation from the Desert Southwest and eastward along Interstate 10 and down into Florida.
Disclaimer and Analogs:
Not all El-Nino’s are the same and the idea of a cold and snowy Eastern USA may not verify if a +NAO occurs. This would create ridging in the southeastern USA and is why the December and January portion of 2006-07 was Warmer than Normal.
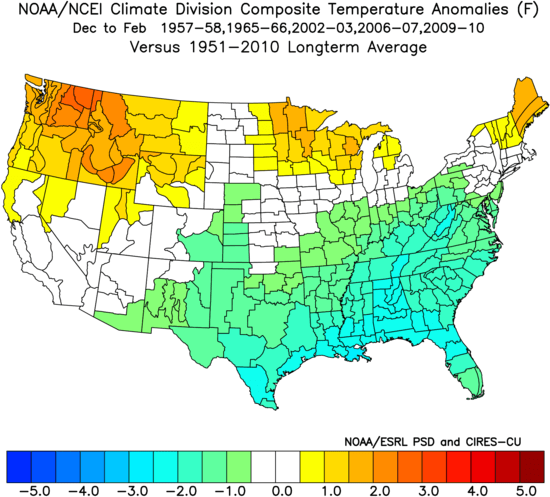
Our Analogs which are years in which the forecasted weather pattern is expected to be most similar to are:
1957-58
1965-66
2002-03
2006-07
2009-10
It should be noted that 4 out of 5 of the winters were below average temperature wise in the Eastern 1/3rd of the USA as a whole. The lone exception being 2006-07 due to a warm Dec-Jan period due to a +NAO. It should also be noted that because our weather data only exist back to the 1880’s we don’t have a whole lot of data to work with and therefore the confidence level is lower than normal. Ideally, we would need to have at least 30 examples. 30 is a magic number in statistics in order to run significant statistical analysis on it.